
Introduction
Behavioral neuroscience and economics are two distinct academic disciplines which at first glance would not seem to have much in common. However, a deeper dive into the specifics of each discipline reveals some similarities. Behavioral neuroscience attempts to understand how different parts of the human brain work and how they respond to different stimuli.
Contrary to popular belief, economics is not just the study of the economy; at its most fundamental level it is about how actors (decision makers) respond to incentives, which can be positive or negative. A positive incentive might be a decrease in price while a negative incentive is a fine for not taking a desired action. By studying how behavior changes as a result of these incentives, microeconomics, one of two branches of economics, makes predictions about how individuals will respond under a given set of conditions and constraints. One key difference between neuroscience and economics is that neuroscience tends to be quantitative and data based, while economics is generally theoretical.
Broadly speaking, however, both fields study human behavior. Neuroeconomics sits at the intersection of its component disciplines and attempts to test economic theories by gathering quantitative data with neuroscientific methods. Building off of the proliferation and increased accessibility of neurotechnology, as well as twenty years of neuroscientific, psychological and economic behavioral research, neuroeconomics has the power to enrich our understanding of economics [1][2].
Traditionally, economic models are unconcerned with how the brain makes a decision; instead, they only focus on the outcome and are content with the brain being a black box [2]. However, the field of neuroeconomics seeks to open this black box in order to enrich our understanding of how economic decisions are made, and to identify if the models economics uses are neurologically supported. Thus, many types of situations that can be described using economic models are studied. Three common areas of study are utility theory, decision making under uncertainty, and intemporal choice. In this article, we will discuss utility theory and decision making under uncertainty.
Utility - Economic Background
Since neuroeconomics tests economic theories – models of how we expect people to behave – a useful place to start for both the public and researchers is with the essentials of microeconomic models. First, economics assumes that people are rational. That is, they are self interested and will always do what is best for them. What is the best decision for someone? One method of identifying this is called “expected value,” which is the value of a choice multiplied by the probability of a reward [3]. In this model an actor compares the expected value of different decisions and chooses the option with the highest expected value. For example, should you buy a $45 lottery ticket that has a 50% chance of winning $200, or just keep the $45? To answer this, you compare the expected values. Buying the lottery ticket has an expected value of $100 (value of $200 multiplied by a 50% probability of reward equals a $100 expected value). Keeping the $45 has an expected value of $45 (value of $45 multiplied by a 100% probability of reward). Since the expected value of buying the lottery ticket ($100) is greater than the expected value of keeping the money ($45) you are better off buying the lottery ticket [3].
However, the calculation of expected value is unrealistic for practical purposes. Suppose that the stakes were larger and the situation changes. Now, Person A finds a lottery ticket on the street that has a 50% chance of winning $20,000. Person B offers to buy that ticket for $7,000. Should Person A take the deal for the sure win of $7,000, or should they take their chances with the lottery ticket? A more realistic model of decision making considers other circumstances, such as Person A’s total wealth and the impact all three possible outcomes (a $0 change to wealth, a $7,000 increase to wealth, or a $20,000 increase to wealth) have on them. A model that considers this is called “expected utility theory”.
These three outcomes are inputted into a formula called a utility function, and the output of the function for a given input is therefore called “utility”. Notice that the utility function itself is not defined because it is different for every person since they have different existing wealth, expenses, savings, and financial circumstances. But for convenience we say that it can be defined by some function. Because utility is subjective, it should be thought of as the abstract representation of the value an actor derives from a particular choice. Anytime an actor makes a choice, they compare all the possibilities and use utility to order them. The “best” decision, the one with the highest ranking, has the highest utility. But the size of the difference between any two values of utility is not important; all that matters is that one utility is higher than another.
For the above example with a large lottery ticket, there are two decisions whose utility we compare. The first is the decision to keep the ticket, where we take the average of the utilities for $0 and $20,000 payoffs because there is a 50% chance of each outcome. We compare that expected utility to the expected utility of selling the lottery ticket. Whichever has the greater expected utility is the decision that should be made, regardless of if one utility is marginally larger or orders of magnitude larger than the other.
What makes the preceding two models different is that the first one weighs the probability and the payoff, whereas the second weighs the probability and the utility. That is why it is called expected utility theory; it weighs the probability of a payoff with the utility of a payoff [3].
Utility - Neurological Basis?
A central question neuroeconomics seeks to address is whether there is a neural basis for utility. In other words, does this theoretical quantification of benefit have some neurophysiological underpinning? So far, the answer appears to be yes. One of the first studies in neuroeconomics, by New York University researchers Platt and Glimcher, ran a series of experiments with monkeys to test if the two variables involved in calculating expected utility - payoff and probability - were considered by the brain. The area of the brain being studied was the lateral intraparietal area (LIP), which is believed to be partly responsible for turning sensory inputs into eye-related motor actions [4][5].
Monkeys were shown dots on a screen and the researchers tracked their resulting eye movements [4]. The study consisted of two experiments, the first of which was split into two parts which each controlled one of two variables: the amount of reward and the probability of reward. In these tests, a colored dot was shown followed by other dots. If the monkey tracked the colored dot with its eyes, they were rewarded with a squirt of juice; tracking the other dots resulted in no juice. In the first segment, the monkeys were always rewarded when they tracked the colored dot, but the quantity of juice they received varied. In the second segment, the monkeys always received the same amount of juice, but the probability of receiving the juice upon tracking the colored dot varied [4].
The researchers found that neural activity in the LIP was positively correlated with reward size and the probability of reward, particularly when these variables were uncertain [4]. This was especially present during earlier trials, suggesting that reward size and probability were both important variables in making decisions under uncertainty [4]. This can be interpreted as the monkeys experiencing pattern recognition: at the beginning of the trials while they were attempting to identify a reward pattern, their decisions were made under more uncertainty than in later trials when they had identified the reward pattern.
The second experiment gave monkeys a choice between two dots, each of which resulted in a different amount of juice being given as a reward [4]. The researchers then used single-cell recording to track the activity of 36 neurons in the LIP as the monkeys performed the task. Using the frequency of each choice the monkeys made, the authors estimated the value associated with each choice. They found that the monkeys made choices based on the outcomes with the highest expected value, or, in this experiment, the largest amount of juice. That is, the monkeys considered the expected value of following each dot before deciding which one to follow [4]. This means that the expected value consideration occurred before neural signals were sent out to facilitate eye movement. This step by step process suggests that the neurons in the LIP may be responsible for calculating utility [4]. A follow up study supported this, showing that the LIP is the physiological utility function calculator for eye movement [6]. In this scenario, the LIP calculates expected utility for each decision and then sends signals to other areas of the brain responsible for generating motor commands for the response with the highest utility. However, it should be noted that this does not preclude other areas of the brain from being the utility function for other processes [6].

A second study by Heldmann (2009) combined neuroscientific and empirical economic methods to expand and complicate this neural basis of utility [7]. Traditionally, economists used either lottery games or the bisection method to derive individual utility functions. In a lottery, a certainty equivalence is produced. This is the point at which someone feels indifferent about choosing between a guaranteed payoff now and a higher but more uncertain payoff later. That is, the certainty equivalence is the point at which the sure payoff gives the same utility as the gamble. The reason this can be calculated is that the participants made an affirmative step to choose if they wanted to engage in the lottery or take the sure payoff. Whereas in the bisection method, individuals are presented with two quantities of money and asked to imagine how much utility each would give them. Then they are asked how much money would divide the difference between those amounts of utility in half. For example, a participant is given a choice between $0 and $500 and asked to imagine how much utility they would get from each amount. If they get $250, their utility might be half of the utility received from $500. However, since utility is subjective, halving the monetary value may not halve the utility for the participant. Therefore, they are asked to identify the monetary amount that gives them the median utility. A major difference between these two methods is that in the lottery methods participants made and took a conscious choice to engage in the lottery or take the payoff, whereas in the bisection method they were simply asked to imagine and verbalize their utility. Researchers used the data gathered from these methods to calculate a utility function [7].
From a neurological perspective, the study utilized electroencephalogram technology to record participants’ brain signals via electrodes placed on the scalp while they engaged in either the lottery or bisection method. When neurons in an area of the brain fire, the electrodes are able to pick up small amounts of electricity generated by the cells and amplify them. When these signals repeatedly correlate with “events,” such as a participant making a decision, they are called event related potentials (ERPs) [7]. Researchers in this study measured a specific type of ERP, called error-related negativity (ERN), which is a negative waveform that correlates with the participant making an incorrect action or a decision error. These signals can thus be used to derive a neural basis for the subjective value of a potential payoff. This study predicted that ERNs would be observed in the lottery method because a decision was made, whereas they would not be observed in the bisection method because the participant did not actively make a decision; rather they were tasked with imagining utility. If this is the case, then it suggests that there are different neural mechanisms underlying each of these methods [7].
In fact, ERNs were observed for the lottery and the resulting utility function included some level of risk aversion [7]. Meanwhile, the bisection method had little to no ERN activity, meaning there was no perception of risk associated with the identification of the midpoint in perceived utility. However, the utility functions were found to be mostly the same, having no statistically significant differences. The authors hypothesized that this means the bisection method captures utility of money while the lottery method combines utility and risk. Therefore, if the bisection method is performed first, the utility function derived from it can be fed as an input into the lottery method function, while the probability of winning is varied experimentally [7]. This will allow future studies to calculate utility empirically and tease apart both utility and risk.
Decision Making Under Uncertainty
Risk and uncertainty. These might sound similar, but to economists they are very different things [8]. In a situation with multiple possible outcomes, there is risk associated with a choice if a quantifiable and “true” probability is associated with it. In contrast, choices are uncertain when the probability is incalculable, but is still known to exist [8]. You might know that a fire could burn down your house, but because you cannot calculate that probability, the decision to purchase insurance is considered a decision made under uncertainty [9]. In contrast, if you take a bet based on the outcome of rolling a six sided die, then you are making a risky decision since there is a ⅙ probability of that outcome.
Expected utility theory is not always the best model to use. In fact, the field of behavioral economics has produced alternative models that are more realistic in that they reflect actual human behavior more often. One of the first was called prospect theory. Prospect theory starts with the assumption that individuals view gains and losses from a reference point rather than in terms of how the value of their assets changes [10]. In other words, when working from a reference point, someone might say, “I have $40,000 now and a 50% chance of winning or losing $20,000” instead of “I have a 50% chance of either winning or losing $20,000.” The difference between these is subtle because it results in people analyzing gains and losses from a reference point (the starting value), rather than net asset value.
The second critical assumption of prospect theory is that people tend to avoid taking risks [10]. In particular, individuals are risk averse with respect to gains and risk acceptant with respect to losses. This means people feel more sad about losses then they do happy for gains, even if the total change (say, plus or minus $500, is the same). For example, individuals preferred a guaranteed outcome of a $3,000 gain compared to an 80% chance of winning $4000 and a 20% chance of nothing. However, the expected utility of this risky decision is $3,200, making this result incompatible with expected utility theory because $3,200 is greater than $3,000 so it should be preferred. With respect to losses, the groundbreaking study introducing prospect theory found that individuals were risk acceptant, with 92% of respondents preferring an 80% chance of losing $4000 and 20% chance of losing nothing, compared to a 100% chance of losing $3000 [10].
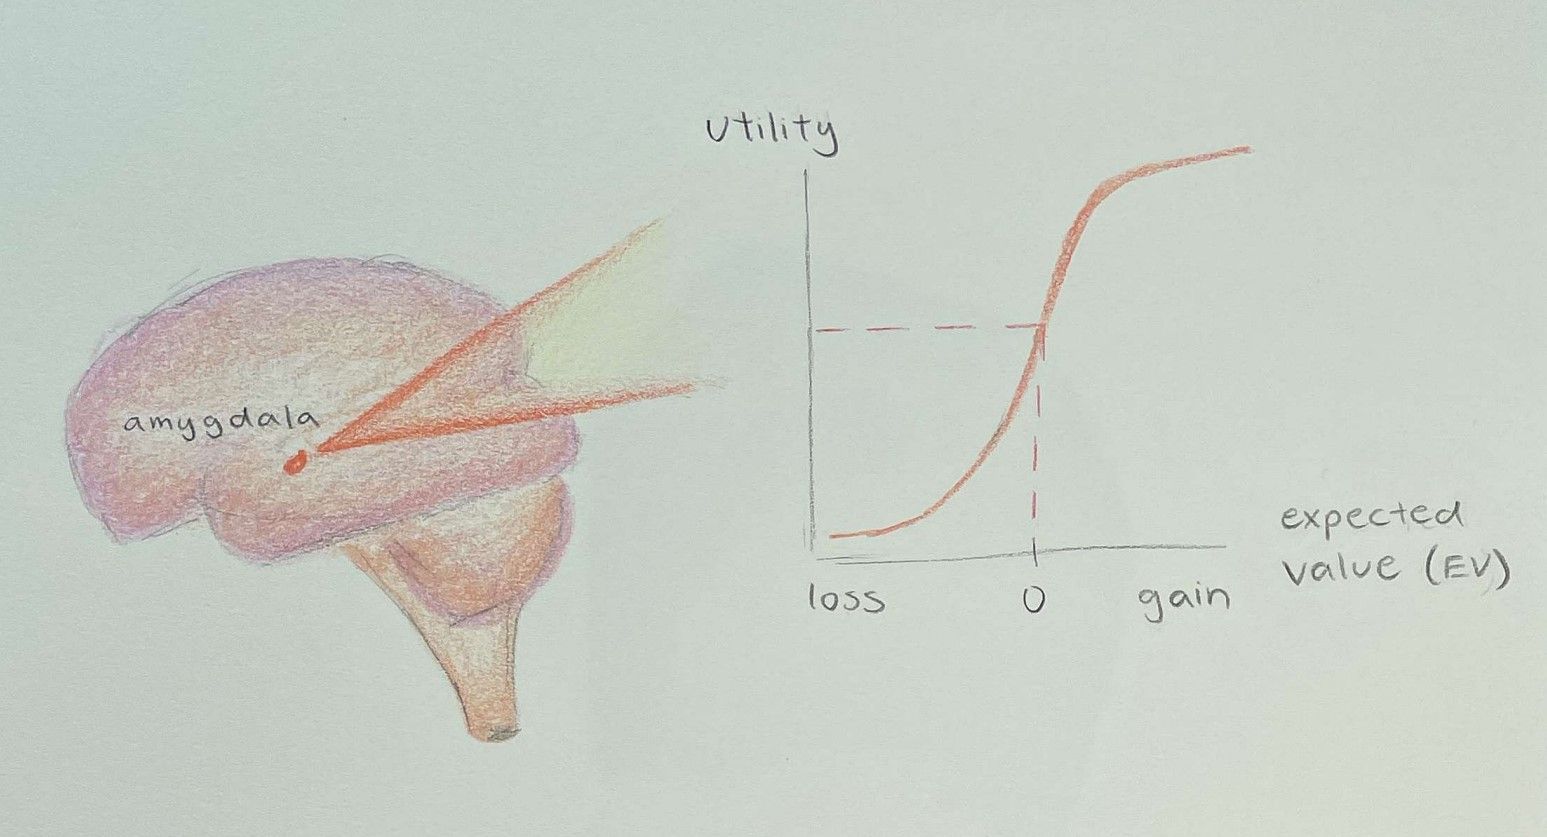
Given that one of the major challenges with economics is that it is highly theoretical, is there a neurophysiological basis to this, beyond participant studies? Indeed there is. In order to study the causal relationship between the brain and loss aversion, a 2010 study by De Martino and colleagues was conducted involving two patients with amygdala lesions. These patients were chosen because the amygdala is the emotional center of the brain, and the researchers hypothesized that the amygdala facilitates and controls loss aversion. The researchers gave two women with amygdala damage in both brain hemispheres $50 at the start of the experiment [11]. In each round, the participants chose whether or not to take a bet with an equal chance of winning and losing. The potential wins and losses varied in $2 increments from $20 to $50 and -$20 to -$50, and all possible combinations were shown only once. So while the chance of winning or losing was always the same, the exact amount that the participant would win or lose varied. Following standard practice to ensure each combination was analyzed independently, they were told that one combination would be randomly selected and a payment made based on their decision. Any loss would be paid from the $50 they started with. For each of the two participants, six neurotypical controls matching age, gender, income, and education level also played the game [11].
Each of the combinations of wins and losses had an expected value (“EV”) associated with it [11]. These expected values were entered into a statistical model as an independent variable, with the dependent variable being the participant’s choice. This model created an indifference point, known as a “risk premium”, or the point where the individual is indifferent between accepting and rejecting the gamble. Risk premium is the amount you need to be paid more to take the gamble. Thus, at the indifference point the participant has a 50% chance of accepting the bid and a 50% chance of declining [11].
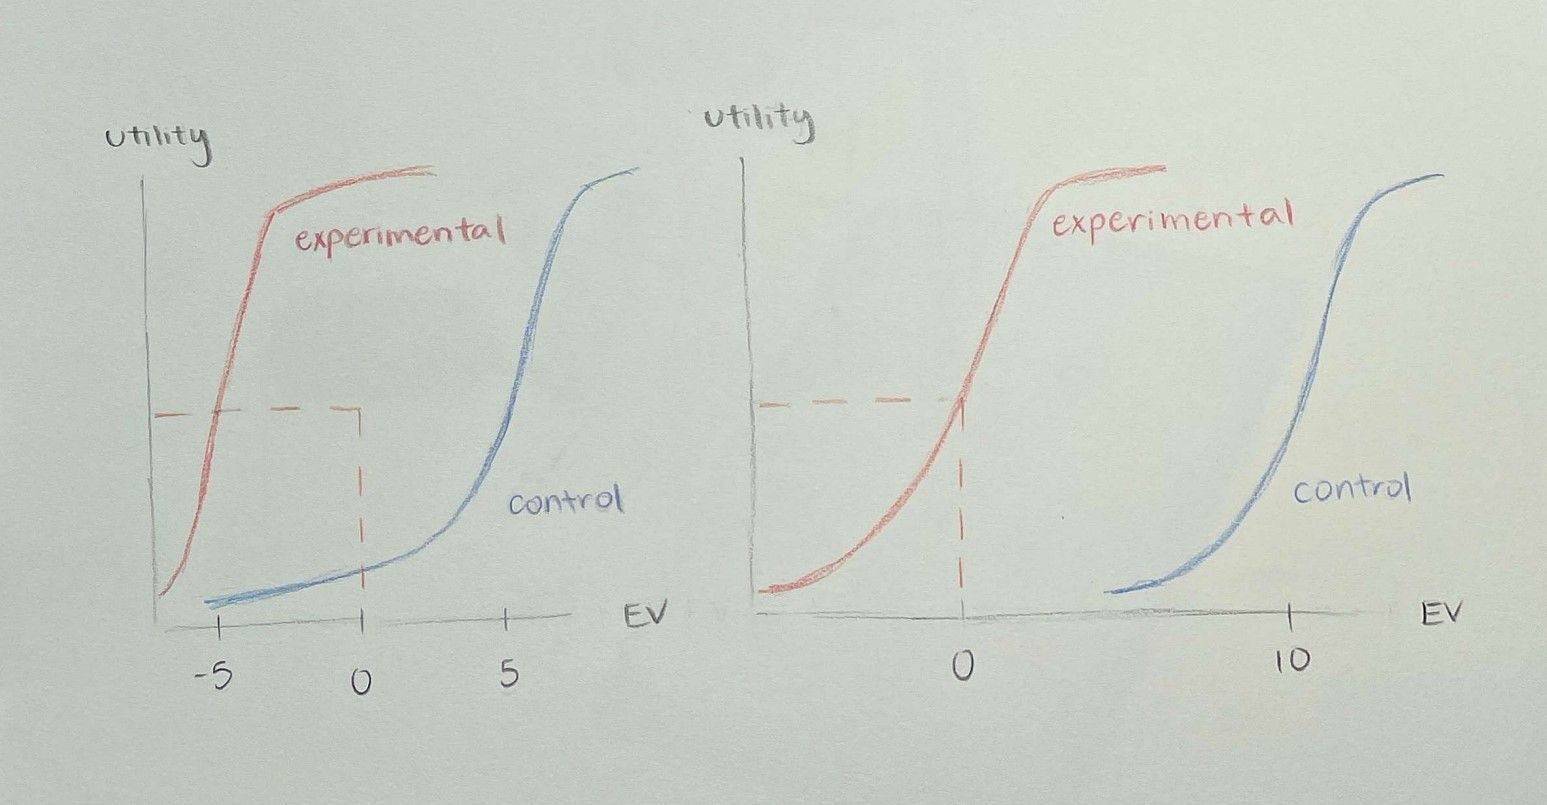
Under an expected utility theory model, we would expect rational actors to decline all bids with a negative EV and accept those with a positive EV. However, the two brain lesion patients experienced a “dramatic absence of loss aversion”, meaning their indifference points were well below zero [11]. This is because an indifference point below zero indicates loss seeking behavior while a positive indifference point indicates loss averse behavior. The first participant (identified as S.M.) had an indifference point with an EV of around -5, while her control group had an indifference point with an EV = 5. This tells us that S.M. lost her loss aversion characteristics and engaged in some slight loss-seeking behavior. The second participant (identified as A.P.) had a risk premium of zero, which led her to be more loss-neutral. In this way, she is a “rational” actor as economists would describe. In contrast, the healthy controls were significantly loss averse with expected values at the indifference point being 5 (for S.M.’s controls) and almost 10 (for A.P.’s controls). This also provides empirical backing for loss aversion in most individuals. The authors hypothesized that the difference between these two patients may be attributed to demographic differences, or possibly due to S.M.’s amygdala damage being more extensive than A.P.’s [11].
Additionally, as with any study involving a small number of participants, the results of this study may not be generalizable as a smaller sample size leads to increased uncertainty. To confirm these results, studies involving more individuals should be conducted.
Neural Models for Loss Aversion
So far, most of the neuroeconomic research presented has attempted to identify if a process economics predicts occurs in the brain, and if so, where it occurs. However, a major challenge with this branch of neuroeconomics is that, thus far, it generally does not produce new insights for either field; it just confirms or denies that an existing economic model is real. In order for neuroeconomics to make an impact on either the overarching fields of neuroscience or economics, it must utilize the methods and models of the fields to make new predictions or test new hypotheses.
Addressing this need, in 2019 Sokol-Hessner and Rutledge proposed a neural model for loss aversion. There is already significant neuroscientific and psychological research into the basis of asymmetric gains and losses, and both gains and losses individually [12]. Specifically, they theorize that areas of the brain called the striatum and the amygdala appear to be correlated with loss aversion. The striatum is a region of the brain found within the basal ganglia, an area known to influence motor control, executive functioning, and emotions [13]. One major neurotransmitter that is released in the striatum is dopamine, which is associated with reward and risk-taking behavior [12]. However, dopamine has not been related to the process of loss aversion itself [12]. On the other hand, the amygdala, an area of the brain known to be associated with fear processing, connects to the basal ganglia to help facilitate processing of emotions [14]. The amygdala projects to the striatum, and its activity is modulated by a neurotransmitter called norepinephrine, which Soko-Hessner and Rutledge proposed is sensitive to potential losses [12].
Using this, the researchers proposed that the striatum processes reward information and reward-related behaviors through dopamine while the amygdala regulates losses and loss behavior through inputs to the striatum [12]. This means that changes to the amount of dopamine will only make an impact on decision making with gains, while increase in amygdala activity will only increase the tendency to avoid losses. Using these inputs, the striatum performs calculations that ultimately influence whatever decision is being made [12].
Conclusion
In summary, neuroeconomics represents an expanding and innovative interdisciplinary field. By using neuroscientific methods to record brain activity, it can shed light on utility theory and decision making, cooperation, and other behavioral processes. This will allow economic theories to be tested and validated experimentally, and provide empirical backing for new and improved theoretical models.
However, this last point also represents a major challenge with neuroeconomics. To date, it has not provided such models. Instead, it has mostly shown that the traditional predictions of economic models either do or do not exist. More studies that attempt to bridge theory and practical problems would help address this gap. There are many practical situations that can be studied, such as explaining addiction, food craving, habitual decision making, gambling, financial decision making, and investor behavior [15][16][17][18][19][20]. While these might seem like out of place examples, they are not because they each deal with value based decisions. Deciding what to eat, to place a bet, or to use your money in a certain way all require an actor to consider a range of possible alternatives and evaluate them, which is what economic models help us predict.
As previously alluded to, another challenge with human behavioral neurosciences is sample size. While methods such as functional Magnetic Resonance Imaging (fMRI) and electroencephalogram technology (EEG) are commonplace, they remain expensive, limiting the sample sizes that can be used in a given study. Additionally, while brain lesion studies such as the one done on loss aversion are one of the only ways to identify causal relationships in behavioral neuroscience, they have incredibly small sample sizes that can limit their generalizability.
References
- Loewenstein, G., Rick, S., & Cohen, J. (2007). Neuroeconomics | Annual Review of Psychology. Annual Review of Psychology, 59, 647–672. https://www.annualreviews.org/doi/full/10.1146/annurev.psych.59.103006.093710
- Camerer, C., Loewenstein G., & Prelec D. (2005). Neuroeconomics: How Neuroscience and Inform Economics. Journal of Economic Literature, 43(1), 9-64. https://pubs.aeaweb.org/doi/10.1257/0022051053737843
- Caplin, A., & Glimcher, P. W. (2014). Basic Methods from Neoclassical Economics. In P. W. Glimcher & E. Fehr (Eds.), Neuroeconomics (2nd ed., pp. 3–17). Academic Press. https://doi.org/10.1016/B978-0-12-416008-8.00001-2
- Platt, M. L., & Glimcher, P. W. (1999). Neural correlates of decision variables in parietal cortex. Nature, 400(6741), 233–238. https://doi.org/10.1038/22268
- Christopoulos, V. N., Kagan, I., & Andersen, R. A. (2018). Lateral intraparietal area (LIP) is largely effector-specific in free-choice decisions. Scientific Reports, 8(1), 8611. https://doi.org/10.1038/s41598-018-26366-9
- Glimcher, P. W., Dorris, M. C., & Bayer, H. M. (2005). Physiological utility theory and the neuroeconomics of choice. Games and Economic Behavior, 52(2), 213–256. https://doi.org/10.1016/j.geb.2004.06.011
- Heldmann, M., Vogt, B., Heinze, H.-J., & Münte, T. F. (2009). Different methods to define utility functions yield similar results but engage different neural processes. Frontiers in Behavioral Neuroscience, 3. https://doi.org/10.3389/neuro.08.043.2009
- Knight, Frank. 1921. “The Meaning of Risk and Uncertainty.” In Risk, Uncertainty and Profit, Hart, Schaffner, and Marx, 197–232.
- Varian, Hal. 2014. “Uncertainty.” In Intermediate Microeconomics: A Modern Approach, University of California at Berkeley: W. W. Norton & Company, 217–35.
- Kahneman, D., & Tversky, A. (1979). Prospect Theory: An Analysis of Decision under Risk. Econometrica, 47(2), 263–291. https://doi.org/10.2307/1914185
- Martino, B. D., Camerer, C. F., & Adolphs, R. (2010). Amygdala damage eliminates monetary loss aversion. Proceedings of the National Academy of Sciences, 107(8), 3788–3792. https://doi.org/10.1073/pnas.0910230107
- Sokol-Hessner, P., & Rutledge, R. B. (2019). The Psychological and Neural Basis of Loss Aversion. Current Directions in Psychological Science, 28(1), 20–27. https://doi.org/10.1177/0963721418806510
- Lanciego, J. L., Luquin, N., & Obeso, J. A. (2012). Functional Neuroanatomy of the Basal Ganglia. Cold Spring Harbor Perspectives in Medicine, 2(12). https://doi.org/10.1101/cshperspect.a009621
- Baxter, M. G., & Croxson, P. L. (2012). Facing the role of the amygdala in emotional information processing. Proceedings of the National Academy of Sciences, 109(52), 21180–21181. https://doi.org/10.1073/pnas.1219167110
- Lis, S., & Kirsch, P. (2016). Neuroeconomic approaches in mental disorders. In Neuroeconomics (pp. 311–330). Springer-Verlag Publishing. https://doi.org/10.1007/978-3-642-35923-1_16
- Konova, A. B., Louie, K., & Glimcher, P. W. (2018). The computational form of craving is a selective multiplication of economic value. Proceedings of the National Academy of Sciences, 115(16), 4122–4127. https://doi.org/10.1073/pnas.1714443115
- Camerer, C., Landry, P., & Webb, R. (Forthcoming). “A Neuroeconomic Theory of Habit” In The State of Mind in Economics. Oxford University Press.
- Genauck, A., Quester, S., Wüstenberg, T., Mörsen, C., Heinz, A., & Romanczuk-Seiferth, N. (2017). Reduced loss aversion in pathological gambling and alcohol dependence is associated with differential alterations in amygdala and prefrontal functioning. Scientific Reports, 7(1), 16306. https://doi.org/10.1038/s41598-017-16433-y
- Bossaerts, P. (2009). What Decision Neuroscience Teaches Us About Financial Decision Making. Annual Review of Financial Economics, 1, 383–404. https://doi-org.offcampus.lib.washington.edu/10.1146/annurev.financial.102708.141514
- Frydman, C., Barberis, N., Camerer, C., Bossaerts, P., & Rangel, A. (2014). Using Neural Data to Test a Theory of Investor Behavior: An Application to Realization Utility. The Journal of Finance, 69(2), 907–946. https://doi.org/10.1111/jofi.12126